Blog
Can You Score the Next Redevelopment Zone From Public Building Records Alone?
- open-data
- zone-discovery
- data-experiment
Where the next redevelopment will happen is usually a judgment call. The experience of a broker who has worked the area for years, days of walking the streets, a rumor that someone is forming a promotion committee.
But the raw material for that judgment — how old the buildings are, whether a block meets the legal thresholds — already sits inside data the government has published.
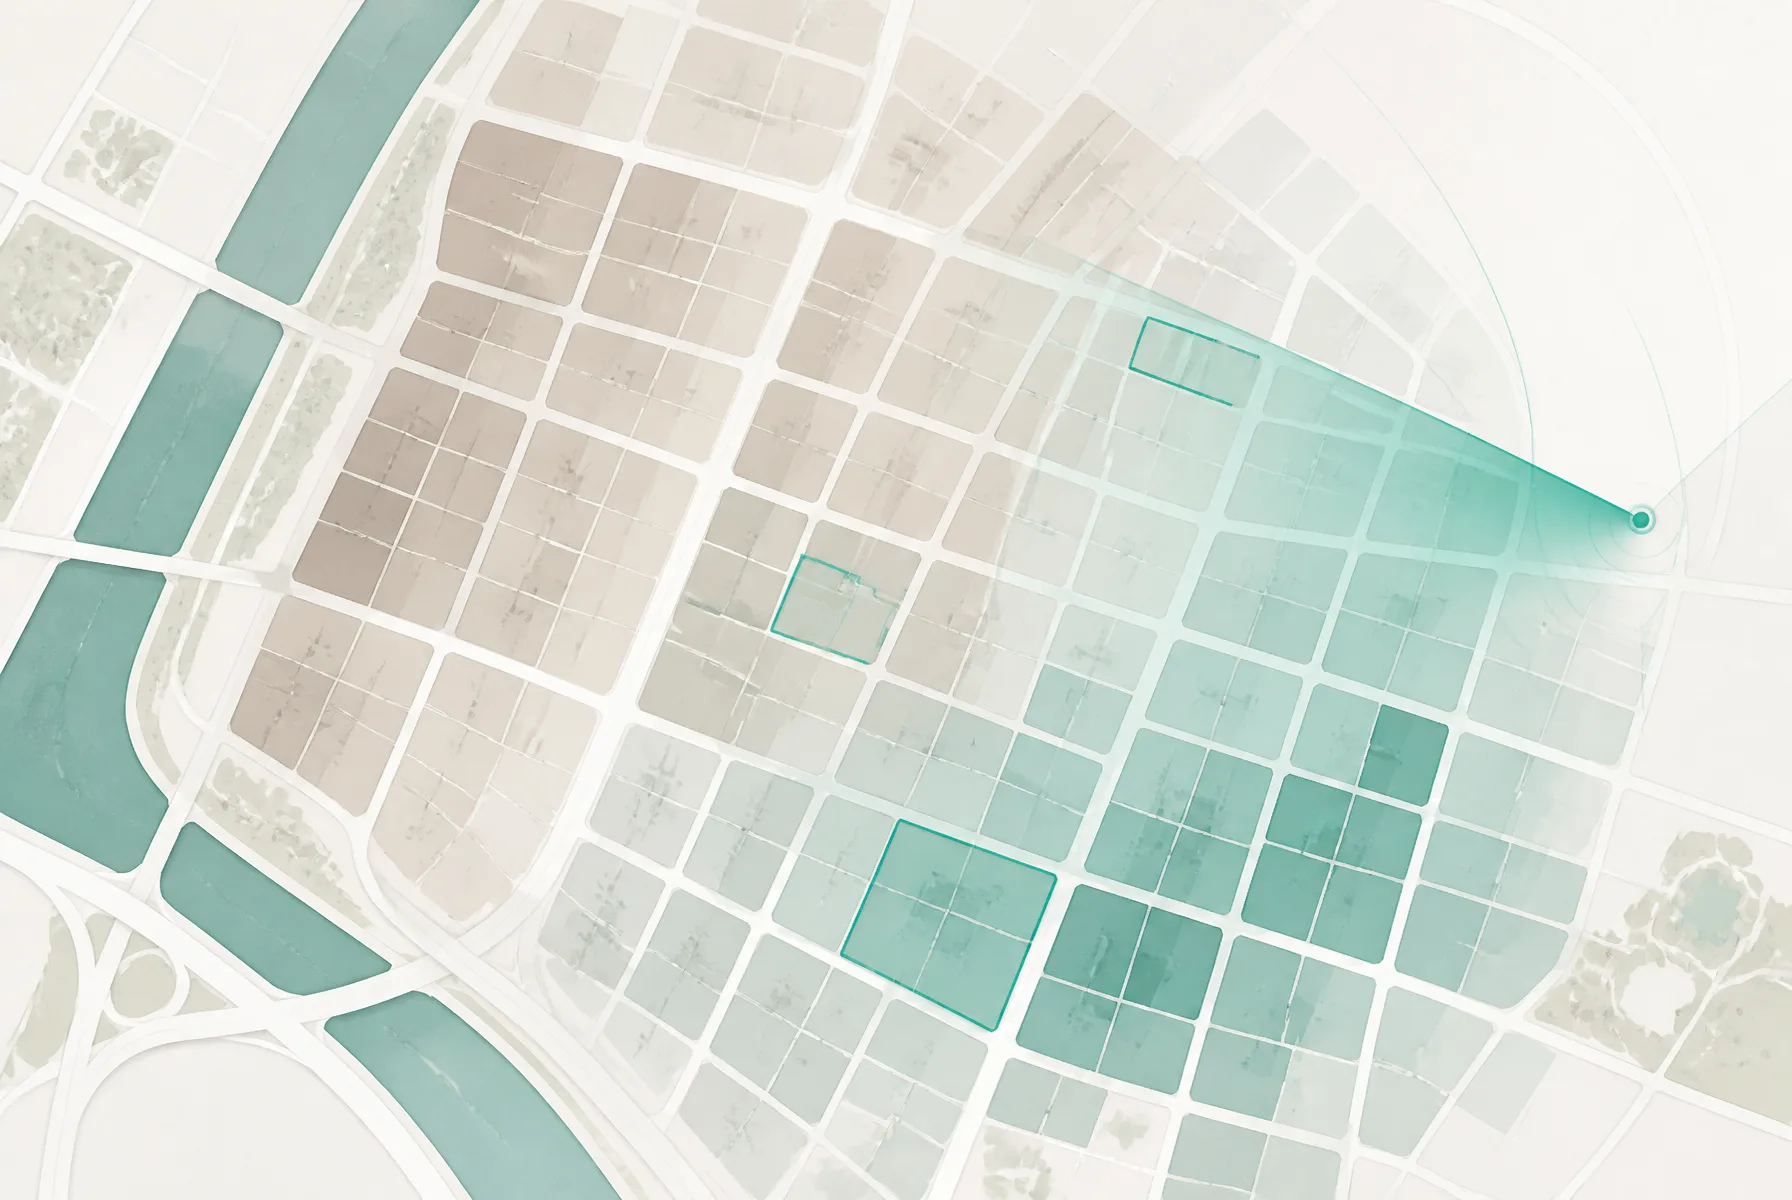
So we tried it. We built a small engine that takes a single district code and paints aging blocks onto a map as a score. This post is a record of how far that gets you, and exactly where it stops.
What "discovering" a redevelopment zone means
Redevelopment does not start just anywhere. The law requires a project to clear specific thresholds before it can begin: the share of old or substandard buildings, the area of the block, dwelling-unit density, the share of frontage touching a road.
Discovery means finding, ahead of time, which neighborhoods already clear those thresholds. Long before an association forms or a zone is designated, you learn that "on paper, the conditions here are met."
The key point is that much of this first-stage requirement can be computed from public data alone.
Which public datasets get you a map
Four datasets are enough to draw one map.
| Dataset | Source | What it gives you |
|---|---|---|
| Building registry | Korea MOLIT open API | Approval date → past 30 years? → aging ratio |
| District boundary | V-World administrative GeoJSON | The base for drawing zones on a map |
| Road network | OpenStreetMap | Extracting a road-enclosed block (a street block) |
| District code | Public code data | The input that points to a city/district/neighborhood |
All of it is free, and none of it touches personal data like property deeds. We use only published facts: a building's age and use, the position of a road.
Cut zones by roads, score them by age
One map comes out of four stages.
one district code
   → classify buildings   old / new / commercial, by approval date
   → cluster by distance   group nearby aging buildings
   → cut by roads          close the road graph into street blocks
   → judge thresholds      grade by age, area, frontage
- Classify buildings. Read each building's approval date; if it is over 30 years old, mark it "aging."
- Cluster by distance. Group aging buildings that sit close together (within roughly 40m) into one mass.
- Cut by roads. Treat the OSM road network as a planar graph and close the road-enclosed faces into "street blocks." Real zone boundaries are usually drawn along roads.
- Judge thresholds. Grade each street block on whether it clears first-stage requirements like 60% aging and 10,000㎡ of area.
Running it on Galhyeon-dong, Eunpyeong-gu
We ran this pipeline on a single neighborhood, Galhyeon-dong in Eunpyeong-gu, Seoul. The figures below are validated against real data.
- Across all buildings in the neighborhood, 63% are aging, 6% are new. Aging residential buildings alone: 576.
- From 356 street blocks cut by roads, we narrowed down to 32 redevelopment candidates that clear the first-stage thresholds.
- Graded out, the 32 split into 5 at the full-redevelopment level and 27 at the street-housing level.
- Open the highest-scoring zone and you find that, of 244 buildings inside the boundary, 188 are slated for demolition, 53 are retained, and 2 are commercial. Looked at on its own, this zone's aging ratio climbs to 77%.
That is the starting point a person would otherwise reach through days of legwork, produced by feeding one line of code a single neighborhood.
What the data still cannot do
This is the part that matters. The score is a "condition for being possible," not "it will happen."
Some metrics, like frontage ratio, still come out rough. The road graph reaches into narrow alleys, so frontage reads 82% — higher than reality. You cannot take the number at face value; you have to read the reason behind the verdict alongside it.
The bigger limit is that discovery only sees the first signal of being possible. We look at a zone along five axes.
- Will it qualify — age and legal thresholds
- Will the economics hold — feasibility
- Will it move fast — resident consent and speed
- Will it sell — location and demand
- Will it stay clean — disputes and risk
Right now, the only axis firmly filled by public data alone is the first one. Feasibility, resident consent, litigation, and the rest get filled only with other data — transactions, project status, court records — and human verification.
Discovery is the work of forming a hypothesis. Verification is still a human job.
Frequently asked questions
Do you use property deeds or personal data?
No. We use only the building registry's age and use data, plus public road and boundary data. Owners' personal information is not handled at the discovery stage.
What defines the aging ratio?
We look at whether a building is over 30 years old, based on its approval date. Because we recompute it per candidate zone rather than across the whole neighborhood, one zone in the Galhyeon-dong case came out at a 77% aging ratio.
Can I invest based on this score alone?
No. The score is only a first signal of feasibility; it does not include economics, consent, or disputes. Use it as a starting point to narrow candidates, and make actual decisions on top of further verification.
So, can you score it?
Back to the opening question. Can you score the next redevelopment zone from building records alone? The answer is "as far as candidates, yes; as a conclusion, no."
Public data takes the candidates a person would narrow over days of legwork and narrows them in minutes with one line of code. The work of weighing the economics and checking the site afterward does not shrink. It only becomes clear where to look first.
At CtreehouseLab we are attaching experiments like this to different stages of a redevelopment project — from discovery to feasibility analysis, recordkeeping, and decision-making — making scattered public data legible on a single screen.